Friday, 15 July 2016

STATISTICAL REPRESENTATION

OBJECTIVES

1. The use of line graph
2. The use of Bar Chart 
3. The use of Pie Chart 

Introduction...

Sometimes, data can be big and large. In order to summarize this, we construct a diagram to make it more understand and easier. Thus, line graph, bar chart and pie chars been introduce.

Line Graph 

Definition - a line graph is a graph that shows data or information that changes continuously over time. 

example of a line graph of a student who scored in maths


Example of Temperatures in New York 


Bar Chart
Definition - A bar chart is a type of diagram that shows by the height or length of lines or rectangles of equal width. 

An example of a bar chart that shows the favorite season in a class 
Let's take a look...


Pie Chart 

Definition - From the word "pie", we imagine the food pie that we used to ate, its round in shapes. A pie chart is a type of graph in which a circle is divided into sectors that each represent a proportion of the whole. 

An example of a pie chart


Let's take a look...


SETS 2

Objectives 

1. The use of Venn Diagram 

What is Venn Diagram?
Venn Diagram is a diagram which represent mathematical pictorially as circles within the universal sets


Lets take some example..


Lets take an exercise...

 exercise 1 : 


STEM AND LEAF

Objectives 

1. Knowing how to use stem and leaf formula 
2. Using stem and leaf in mean, median, mode.

What is Stem and Leaf?
A stem and leaf diagram is a frequency diagram.

Lets take an example... 

Example 1:
Below is a stem and leaf diagram showing the number of primary student on 15 bus journey to school


Example 2: 

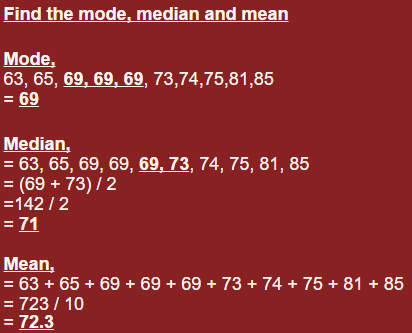
Here are the scorer by 10 students in maths test.

63 85 75 69 73 65 81 74 69 69 


1, Put tens in the left as stem 
2. it is easier to put the units in an unordered list
3.  rewrite the digits in order 


Example 3:
Construct the stem and leaf diagram according to the numbers given below

54, 53, 56, 45, 43, 47, 22, 32, 


2 | 2
3 | 2
4 | 3   5   7   
5 | 3   4   6


Exercise to try!

Construct a stem and leaf diagram for the following numbers:-

(a) 12, 13, 17, 23, 18, 45,33
(b) 11, 13, 16, 18, 15, 15, 22, 23, 24


Wednesday, 13 July 2016

PERMUTATION AND COMBINATION

OBJECTIVES 

1. Define Permutation and Combination 
2. Learn how work on Permutation and Combination 

What is permutation? 
Permutation is a calculation of the number of different ways that a certain number of objects can be arranged in order from a huge number of objects. 

Working for Permutation: 


What is Combination? 
Combination is a collection of the number of different ways that a certain number of objects as a group be selected from a large number of objects.

Working for Combination:


Always REMEMBER

n = permutation 
r = Number Selected 
! = Factorial 

Lets take a look on some examples

Example 1
 How many ways you can arrange 8 objects

Permutation 


Combination 


Lets take another example...


Example 2 : 
Example 2 Permutation

let's say we just want to know which 3 pool balls are chosen, not the order.
We already know that 3 out of 16 gave us 3,360 permutations.
But many of those are the same to us now, because we don't care what order!

Example 2 Combinations


Example 3 :

How many permutations of 3 different digits are there, chosen from the ten digits 0 - 9 inclusive

Such as drawing ten numbered marbles from a bag, without replacement


Lets take an exercise...

exercise 1 

How many permutations of 4 different letters are there, chosen from the twenty six letters of the alphabet? 


SETS 1

OBJECTIVES 

1. Define Sets 
2. Understand types of sets

What is sets? 
A set is a collection of well defined entities. objects, or elements. 


Types of sets:

1. Universal Sets - it is a collection of all elements in a application. All the sets in that application are subset of this universal sets. 

Example : 
We may define U as the set of all Euro Qualifiers on european cup (football). In this case, set of all euro qualifiers is a subset of U, Set of all Asean qualifiers is subset of of U and America is also subset of U. 

2. null/ Empty Sets - it is an empty set contains no elements. it is symbolize as 

Example : 

{ } = 
A= {1,3,5,7}
B= {2,4,6,8}
A⋂ B= { } = 
3. Equal Sets - it is a two sets contain the same elements they are said to be equal. 

Example : 
If A = {2,3, 4} and B = {4,2,3}, they are equal as every element of set A is an element of set B. 

4. Equivalent Sets - it is a set if the cardinalities of two sets are same. 

Example : 
If A = {2,3,4} and B = {5,6,7}, they are equivalent as cardinality of A is equal to the cardinality of B. 

|A| = |B| = 3


MEASURE OF DISPERSION PART 2

Objectives: 

1. The meaning of Standard Variation 
2. Measure of tendency(average) 
3. Standard deviation is linked to the mean

What is the meaning of Standard Variation?
Standard Variation is a method of measure of how spread out numbers are. 

"What is variance?" 
Definition - The average of the squared differences from the mean. 

To find Variance...
You must follow this steps:

1. Find the mean 
2. Find the deviation from the mean
3. Square the deviation from the mean 
4. Find the sum of the squares 
5. Divide the sum of the squares by the number of items 

There are two ways of finding variance 


If small data or a sample

if big data or a population


After finding variance, now we can find the standard deviation. How to find standard deviation? We just find the square root of the variance.

Let's take an example...

Example 1


Example 2 

What is the population standard deviation for the numbers : 75, 83, 96, 100, 121 and 125? 


Example 3 

A booklet has 12 pages with the following numbers of words : 
271, 354, 296, 301, 333, 326, 285, 298, 327, 316, 287 and 314

What is the standard deviation number of words per page? 


lets take an exercise...

Nine friends each guessed the number of marbles jar. 

When the answer was revealed they found they had guessed well (and one was the winner) 

Here is how the close they each got : 

-9, -7, -4, -1, 0, 2, 7, 9, 12 

(A negative number shows an underestimate, a positive number shows an overestimate) 

what was the standard deviation of their errors? 


MEASURE OF DISPERSION PART 1

OBJECTIVES 

1. The definition of Measure of Dispersion 
2. Finding Range
3. The use of Interquartile range 

What is Measure of Dispersion? 
Measure of Dispersion are used examine the spread of data. 

Types of methods that are used: 
1. Range 
2. Quartiles

Range

What is range? From the word itself it means the area of variation between upper and lower limits on a particular scale. In this case, to find range, the largest value are been minus with the smallest value in data set. 

Range = x (max value) - x (min value) 

Example 

4, 7, 3, 8, 9

9 - 3 = 6 

Quartiles 

What is mean by quartiles? In statistics, quartile is each of four equal groups into which a population can be divided according to the distribution of values of a particular variable. From the word itselfs, QUARtile, Quar means four.


example 1:

Write down the range, upper quartile and lower quartile for the following numbers:

Data : 2, 4, 6, 10, 13, 15

range = highest - lowest 
= 15 - 2
Range = 13

median = (10+6)/2 = 8
lower quartile = 4
upper quartile = 13

example 2 : 

Find the lower quartile, middle quartile and upper quartile for the following numbers:

Data : 1, 3, 3, 4, 5, 6, 6, 7, 8, 8 

Lower quartile : 3
Middle quartile : 5.5 
Upper quartile :

example 3 : 

Find the range in between 4, 6, 9, 3, 7 

Range = highest - lowest 

= 9 - 3
= 6


STATISTICS

Objectives 

1. To identify data
2. To learn and identify Qualitative and Quantitative
3. To learn and identify Discrete and Continuous 


DATA

What is Data?
Data is a raw facts or in another word is information.

Data can be collected in any ways.

QUALITATIVE AND QUANTITATIVE

Qualitative is non- numerical data
example : Name of a person who plays guitar 

Quantitative is numerical data 
example : number of the guitar that person used

LETS TAKE SOME EXAMPLES...

Example 1 

The total of tennis ball in a bag 

Answer - Quantitative

Example 2 

The brand of shirts in a shop 

Answer - Qualitative 

Example 3 

The number of houses in a village 

Answer - Quantitative 

Example 4 

The types of houses in a village

Answer - Qualitative 

DISCRETE AND CONTINUOUS 

What is meant by Discrete? 
Discrete is a type of data in which can be counted. The exact amount is the result. 

What is meant by Continuous? 
Continuous is a type of data in which the data can results can be measured like length, width, time, speed and mass. The exact amount cannot be measured exactly.

How to differentiate between Discrete and Continuous? 

Discrete - The total number of cars

Continuous - The speed of the cars 

LETS TAKE SOME EXAMPLES...

Example 1 :

The number of guitars that produced in a factory

Answer - Discrete 

Example 2 : 

The height of the athletes who participates in 400 meters run 

Answer - Continuous 

Example 3 :

The number of laptops in a laboratory 

Answer - Discrete 

Example 4 :

The speed of shuttle cock who smashed by Dato' Lee Chong Wei 

Answer - Continuous 

Lets take an exercise...

Exercise 1 :

Which one of the following is quantitative data?


A) She is black and white

B) She has two ears 

C) She has long hair 

D) She has long tail 


Tuesday, 28 June 2016

MEASURES OF TENDENCY

Objectives: 


1. Find Mode
2. Find Median
3. Find Mean 

Introduction...

What is average?
Average is a number expressing the central or typical value in a set of data, in particular the mode, median, or (most commonly) the mean, which is calculated by dividing the sum of the values in the set by their number, OR constituting the result obtained by adding together several amounts and then dividing this total by the number of amounts. 

How to find Average?
The mean is the average of the numbers. so the way how we find it is add up all the numbers, then divide by how many numbers there are, in other words, it is the sum divided by the number of counts.

By the way, there are few terms that you need to know:

1. Mode - The mode is the common value of the data. 
2. Median - The median is the middle value in a set of data. 
3. Mean - The mean is the average of the sum of numbers then divided by the number of counts.

Lets take some example..

Mode 

Find the mode of: 
black, grey, grey, red, white, grey 
mode = grey

why? because grey has 3 possible modes 
black, grey, grey, red, white, grey 

what if:
black, black, grey, red, white, grey 
mode = black, grey

why? because there is possible to have 2 modes 
black, black, grey, red, white, grey
what if: 
black, grey, red, white
mode = no mode

why? yes it is possible to have no mode. 

Median 

To find median: 
First step is to arrange the numbers in numerical order.

for example: 
9, 7, 6, 5, 2, 3, 1

Arrange it = 1, 2, 3, 5, 6, 7, 9
median = 5 

another example:
In a car company that sells car, there are 8 cars altogether with different prices.
$40, 000, $29, 000, $35, 500, $31, 000, $43 ,000, $30, 000, $27, 000, $32, 000

First step ; Arrange the data from least to Greatest. Then find the middle
= $27, 000, $29, 000, $30, 000, $31, 000, $32, 000, $35, 500, $40, 000, $43, 000

= $31,000, $32, 000 (if there is even number of counting in the middle, we take those two numbers and divide it by 2)

= 31000+32000 = 31,500
             2

= Median is $31,500 


Mean 

The mean is the average of the numbers, then dive by how many numbers there are. 

How to calculate? 
Just add all the numbers then divide by how many numbers there are.

for example: 

Find the mean of 2, 4, and 8? 

First Step: Add all the number = 2 + 4 + 8 = 14
Second Step: Divide the sum of all numbers by the number of counts : = 14 = 4.67 
                                                                                                                      3

= The mean is 4.67


LETS TAKE MORE EXAMPLES...


Example 1 : 
The weekly salaries of six employees at Burger King are $140, $220, $90, $180, $140, $200 
Find the Mean, Median and Mode

Mean : 

= $140 + $220 + $90 + $180 + $140 + $200 
                                  6
$970
     6
= $161.67

Median : 

= $90, $140, $140, $180, $200, $220 
                             2
= $140 + $180 
             2
= $160 

Mode : 

= $140 

Example 2 :

Azwan trapped 10 rabbits, weighed them to the nearest pound, and recorded his results in groups as follows : 

Use the midpoints of the groups to estimate the mean weight of the rabbits Azwan trapped 


Example 3 : 

The populations of crocodiles in 7 national parks is below. Calculate the mean, median and mode.

Data : 14, 13, 8, 19, 13, 24, 15

Mean : 

= 14 + 13 + 8 + 19 + 13 + 24 + 15
                            7
= 106 
     7
= 15.1 Crocodiles 

Median :

= 8, 13, 13, 14, 15, 19, 24 

= 14 Crocodiles 

Mode :

= 13 Crocodiles 

Lets take an exercise...

Exercise 1 :

The number of graffiti convictions for 12 months of monthly data is below. Calculate the mean, the median and the mode. 

Data : 14, 25, 23, 15, 16, 16, 11, 23, 12, 13, 24, 7. 


Thursday, 16 June 2016

PROBABILITY

Objectives:

1. To get to know the function of probability
2. The rules of probability
3. Special rule for addition 
4. Special rule of multiplication 
5. The use of tree diagram

What is the meaning of Probability?
Probability is the like hood or chances of an event occurring, or how likely is something is to happen.

For example:
1. Tossing a coin
2. Throwing dice

Tossing coin - When you are tossing a coin, there are two possible outcomes for each throws, of which head or tail is equal likely. Or, we can say that the probability of the coin landing H(head) is 1/2 or 0.5, and the probability of the coin landing T(tail) is 1/2 or 0.5.

Throwing Dice - When somebody throws a dice, there are SIX possible outcomes, which 1, 2, 3, 4, 5, 6. The probability any one of them is 1/6.

**Always remember, probability is always between 0 AND 1.**


Rules of Probability

1.  Probability - is the measure of how likely the event is. Ex; a spinner landing on blue is 1/4 or a coin flipped lands on a head is 1/2.

2. Experiment - is a situation involving chance or probability that leads to results called outcome. Ex; spinning a spinner once or tossing a coin once.

3. Sample point/outcome - is the result of a single trial of an experiment. Ex; possibilities of landing on a blue, green, red or yellow on a spinner or landing on a head or tails in a coin toss.

4. Certain event/sample space - all the possible outcomes of an experiment(s).

5. Two outcomes are mutually exclusive  when one of them cannot happen if the other occurs. Several outcomes are mutually exclusive if the occurrence of one of them excludes all possibilities of any of the others happening. Ex; on any coin toss, either head or tail may turn up but not both.

6. If two or more events occurs at one time - the events are not mutually exclusive. 

7Independent events are events where the outcome of one of them in no ways affects the outcomes of the others. Ex; whether or not it rains in Australia has no effect on whether or not a football match is cancelled in Brunei.

8. Conditional event is one the outcomes of which is influenced by the outcome of another event. Ex; the probability of a student being able to attend exam would depend on whether they attend the minimum requirement of attendance. 

How to find probability?

In general:

P(A) = The Number Of Ways Event A Can Occur
The total number Of Possible Outcomes

Examples:


The rules of Addition in Probability

Addition rule 1 - When two events are mutually exclusive, the probability that X or Y will occur is the sum of probability of each event.

P(X or Y) = P(X) + P(Y)


The rules of Multiplication in Probability 

In the addition rule, we learn how to find a probability of two events at the same time. This lesson will also deal with multiplication rule. The multiplication rules that we learn now will also deals with two events, but in this problem, the events occur as a result of more than one task (rolling one die after another, drawing two cards, etc). 

If the events X and Y are independent, then the probability that events X and Y will both occur is given by, 

P(X and Y) = P(X) x P(Y) 


The Tree Diagram 

The tree diagrams are useful for organizing the different possible outcomes of an event. For each possible outcome of the first event, we draw a line where we must draw a line where we write down the probability of that outcome and the state of the world if that outcome happened. Then, for each possible outcome of the second event, we do the same thing. 

Below is an example of a simple tree diagram, lets take tossing a coin as example: 


Examples of probability:

Example 1 :
A die is thrown once. What is the probability that the score is a factor of 6?

The factor of 6 are 1, 2, 3, 6 = 4 number of ways
There are 6 possible scores when a die is thrown = 6 Total numbers of outcomes

So...

4/6 = 2/3

Answer is 2/3


Example 2 :
Each of the letter of the word MISSISSIPPI are written on separate pieces of paper that are then folded put in a hat, and mixed thoroughly.

One piece of paper is chosen (without looking) from the hat. What is the probability is it an I? 

There are 4 'I' letters in the word MISSISSIPPI = 4 number of ways
There are 11 letters in the word MISSISSIPPI altogether = 11 total number of outcomes

So...

Answer is 4/11

Example 3 : 
There are 10 counters in a bag: 3 are red, 2 are blue and 5 are green.
The contents oft he bag are shaken before Maxine randomly chooses one counter from the bag.
What is the probability that she doesn't pick a red counter? 

There are 7 counters that are not red: 2 Blue and 5 Green = 7 number of ways
There are 10 total number of outcomes = 10 total number of outcomes 

So...

Answer is 7/10 

Lets take an exercise...

Exercise 1 : 

The diagram shows a spinner made up a piece of card in the shape of a regular pentagon, with a toothpick pushed through its center. The five triangles are numbered from 1 to 5.

The spinner is spun until it lands on one of the five edges of the pentagon. What is the probability that the number it lands on is odd?