Friday, 15 July 2016

STATISTICAL REPRESENTATION

OBJECTIVES

1. The use of line graph
2. The use of Bar Chart 
3. The use of Pie Chart 

Introduction...

Sometimes, data can be big and large. In order to summarize this, we construct a diagram to make it more understand and easier. Thus, line graph, bar chart and pie chars been introduce.

Line Graph 

Definition - a line graph is a graph that shows data or information that changes continuously over time. 

example of a line graph of a student who scored in maths


Example of Temperatures in New York 


Bar Chart
Definition - A bar chart is a type of diagram that shows by the height or length of lines or rectangles of equal width. 

An example of a bar chart that shows the favorite season in a class 
Let's take a look...


Pie Chart 

Definition - From the word "pie", we imagine the food pie that we used to ate, its round in shapes. A pie chart is a type of graph in which a circle is divided into sectors that each represent a proportion of the whole. 

An example of a pie chart


Let's take a look...


SETS 2

Objectives 

1. The use of Venn Diagram 

What is Venn Diagram?
Venn Diagram is a diagram which represent mathematical pictorially as circles within the universal sets


Lets take some example..


Lets take an exercise...

 exercise 1 : 


STEM AND LEAF

Objectives 

1. Knowing how to use stem and leaf formula 
2. Using stem and leaf in mean, median, mode.

What is Stem and Leaf?
A stem and leaf diagram is a frequency diagram.

Lets take an example... 

Example 1:
Below is a stem and leaf diagram showing the number of primary student on 15 bus journey to school


Example 2: 

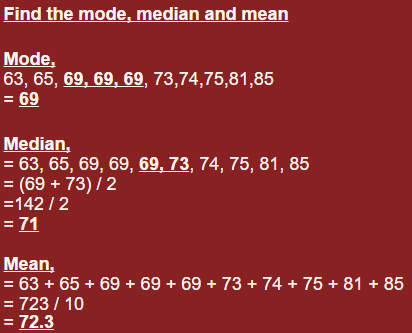
Here are the scorer by 10 students in maths test.

63 85 75 69 73 65 81 74 69 69 


1, Put tens in the left as stem 
2. it is easier to put the units in an unordered list
3.  rewrite the digits in order 


Example 3:
Construct the stem and leaf diagram according to the numbers given below

54, 53, 56, 45, 43, 47, 22, 32, 


2 | 2
3 | 2
4 | 3   5   7   
5 | 3   4   6


Exercise to try!

Construct a stem and leaf diagram for the following numbers:-

(a) 12, 13, 17, 23, 18, 45,33
(b) 11, 13, 16, 18, 15, 15, 22, 23, 24


Wednesday, 13 July 2016

PERMUTATION AND COMBINATION

OBJECTIVES 

1. Define Permutation and Combination 
2. Learn how work on Permutation and Combination 

What is permutation? 
Permutation is a calculation of the number of different ways that a certain number of objects can be arranged in order from a huge number of objects. 

Working for Permutation: 


What is Combination? 
Combination is a collection of the number of different ways that a certain number of objects as a group be selected from a large number of objects.

Working for Combination:


Always REMEMBER

n = permutation 
r = Number Selected 
! = Factorial 

Lets take a look on some examples

Example 1
 How many ways you can arrange 8 objects

Permutation 


Combination 


Lets take another example...


Example 2 : 
Example 2 Permutation

let's say we just want to know which 3 pool balls are chosen, not the order.
We already know that 3 out of 16 gave us 3,360 permutations.
But many of those are the same to us now, because we don't care what order!

Example 2 Combinations


Example 3 :

How many permutations of 3 different digits are there, chosen from the ten digits 0 - 9 inclusive

Such as drawing ten numbered marbles from a bag, without replacement


Lets take an exercise...

exercise 1 

How many permutations of 4 different letters are there, chosen from the twenty six letters of the alphabet? 


SETS 1

OBJECTIVES 

1. Define Sets 
2. Understand types of sets

What is sets? 
A set is a collection of well defined entities. objects, or elements. 


Types of sets:

1. Universal Sets - it is a collection of all elements in a application. All the sets in that application are subset of this universal sets. 

Example : 
We may define U as the set of all Euro Qualifiers on european cup (football). In this case, set of all euro qualifiers is a subset of U, Set of all Asean qualifiers is subset of of U and America is also subset of U. 

2. null/ Empty Sets - it is an empty set contains no elements. it is symbolize as 

Example : 

{ } = 
A= {1,3,5,7}
B= {2,4,6,8}
A⋂ B= { } = 
3. Equal Sets - it is a two sets contain the same elements they are said to be equal. 

Example : 
If A = {2,3, 4} and B = {4,2,3}, they are equal as every element of set A is an element of set B. 

4. Equivalent Sets - it is a set if the cardinalities of two sets are same. 

Example : 
If A = {2,3,4} and B = {5,6,7}, they are equivalent as cardinality of A is equal to the cardinality of B. 

|A| = |B| = 3


MEASURE OF DISPERSION PART 2

Objectives: 

1. The meaning of Standard Variation 
2. Measure of tendency(average) 
3. Standard deviation is linked to the mean

What is the meaning of Standard Variation?
Standard Variation is a method of measure of how spread out numbers are. 

"What is variance?" 
Definition - The average of the squared differences from the mean. 

To find Variance...
You must follow this steps:

1. Find the mean 
2. Find the deviation from the mean
3. Square the deviation from the mean 
4. Find the sum of the squares 
5. Divide the sum of the squares by the number of items 

There are two ways of finding variance 


If small data or a sample

if big data or a population


After finding variance, now we can find the standard deviation. How to find standard deviation? We just find the square root of the variance.

Let's take an example...

Example 1


Example 2 

What is the population standard deviation for the numbers : 75, 83, 96, 100, 121 and 125? 


Example 3 

A booklet has 12 pages with the following numbers of words : 
271, 354, 296, 301, 333, 326, 285, 298, 327, 316, 287 and 314

What is the standard deviation number of words per page? 


lets take an exercise...

Nine friends each guessed the number of marbles jar. 

When the answer was revealed they found they had guessed well (and one was the winner) 

Here is how the close they each got : 

-9, -7, -4, -1, 0, 2, 7, 9, 12 

(A negative number shows an underestimate, a positive number shows an overestimate) 

what was the standard deviation of their errors? 


MEASURE OF DISPERSION PART 1

OBJECTIVES 

1. The definition of Measure of Dispersion 
2. Finding Range
3. The use of Interquartile range 

What is Measure of Dispersion? 
Measure of Dispersion are used examine the spread of data. 

Types of methods that are used: 
1. Range 
2. Quartiles

Range

What is range? From the word itself it means the area of variation between upper and lower limits on a particular scale. In this case, to find range, the largest value are been minus with the smallest value in data set. 

Range = x (max value) - x (min value) 

Example 

4, 7, 3, 8, 9

9 - 3 = 6 

Quartiles 

What is mean by quartiles? In statistics, quartile is each of four equal groups into which a population can be divided according to the distribution of values of a particular variable. From the word itselfs, QUARtile, Quar means four.


example 1:

Write down the range, upper quartile and lower quartile for the following numbers:

Data : 2, 4, 6, 10, 13, 15

range = highest - lowest 
= 15 - 2
Range = 13

median = (10+6)/2 = 8
lower quartile = 4
upper quartile = 13

example 2 : 

Find the lower quartile, middle quartile and upper quartile for the following numbers:

Data : 1, 3, 3, 4, 5, 6, 6, 7, 8, 8 

Lower quartile : 3
Middle quartile : 5.5 
Upper quartile :

example 3 : 

Find the range in between 4, 6, 9, 3, 7 

Range = highest - lowest 

= 9 - 3
= 6


STATISTICS

Objectives 

1. To identify data
2. To learn and identify Qualitative and Quantitative
3. To learn and identify Discrete and Continuous 


DATA

What is Data?
Data is a raw facts or in another word is information.

Data can be collected in any ways.

QUALITATIVE AND QUANTITATIVE

Qualitative is non- numerical data
example : Name of a person who plays guitar 

Quantitative is numerical data 
example : number of the guitar that person used

LETS TAKE SOME EXAMPLES...

Example 1 

The total of tennis ball in a bag 

Answer - Quantitative

Example 2 

The brand of shirts in a shop 

Answer - Qualitative 

Example 3 

The number of houses in a village 

Answer - Quantitative 

Example 4 

The types of houses in a village

Answer - Qualitative 

DISCRETE AND CONTINUOUS 

What is meant by Discrete? 
Discrete is a type of data in which can be counted. The exact amount is the result. 

What is meant by Continuous? 
Continuous is a type of data in which the data can results can be measured like length, width, time, speed and mass. The exact amount cannot be measured exactly.

How to differentiate between Discrete and Continuous? 

Discrete - The total number of cars

Continuous - The speed of the cars 

LETS TAKE SOME EXAMPLES...

Example 1 :

The number of guitars that produced in a factory

Answer - Discrete 

Example 2 : 

The height of the athletes who participates in 400 meters run 

Answer - Continuous 

Example 3 :

The number of laptops in a laboratory 

Answer - Discrete 

Example 4 :

The speed of shuttle cock who smashed by Dato' Lee Chong Wei 

Answer - Continuous 

Lets take an exercise...

Exercise 1 :

Which one of the following is quantitative data?


A) She is black and white

B) She has two ears 

C) She has long hair 

D) She has long tail